

What they are and why every business needs one.
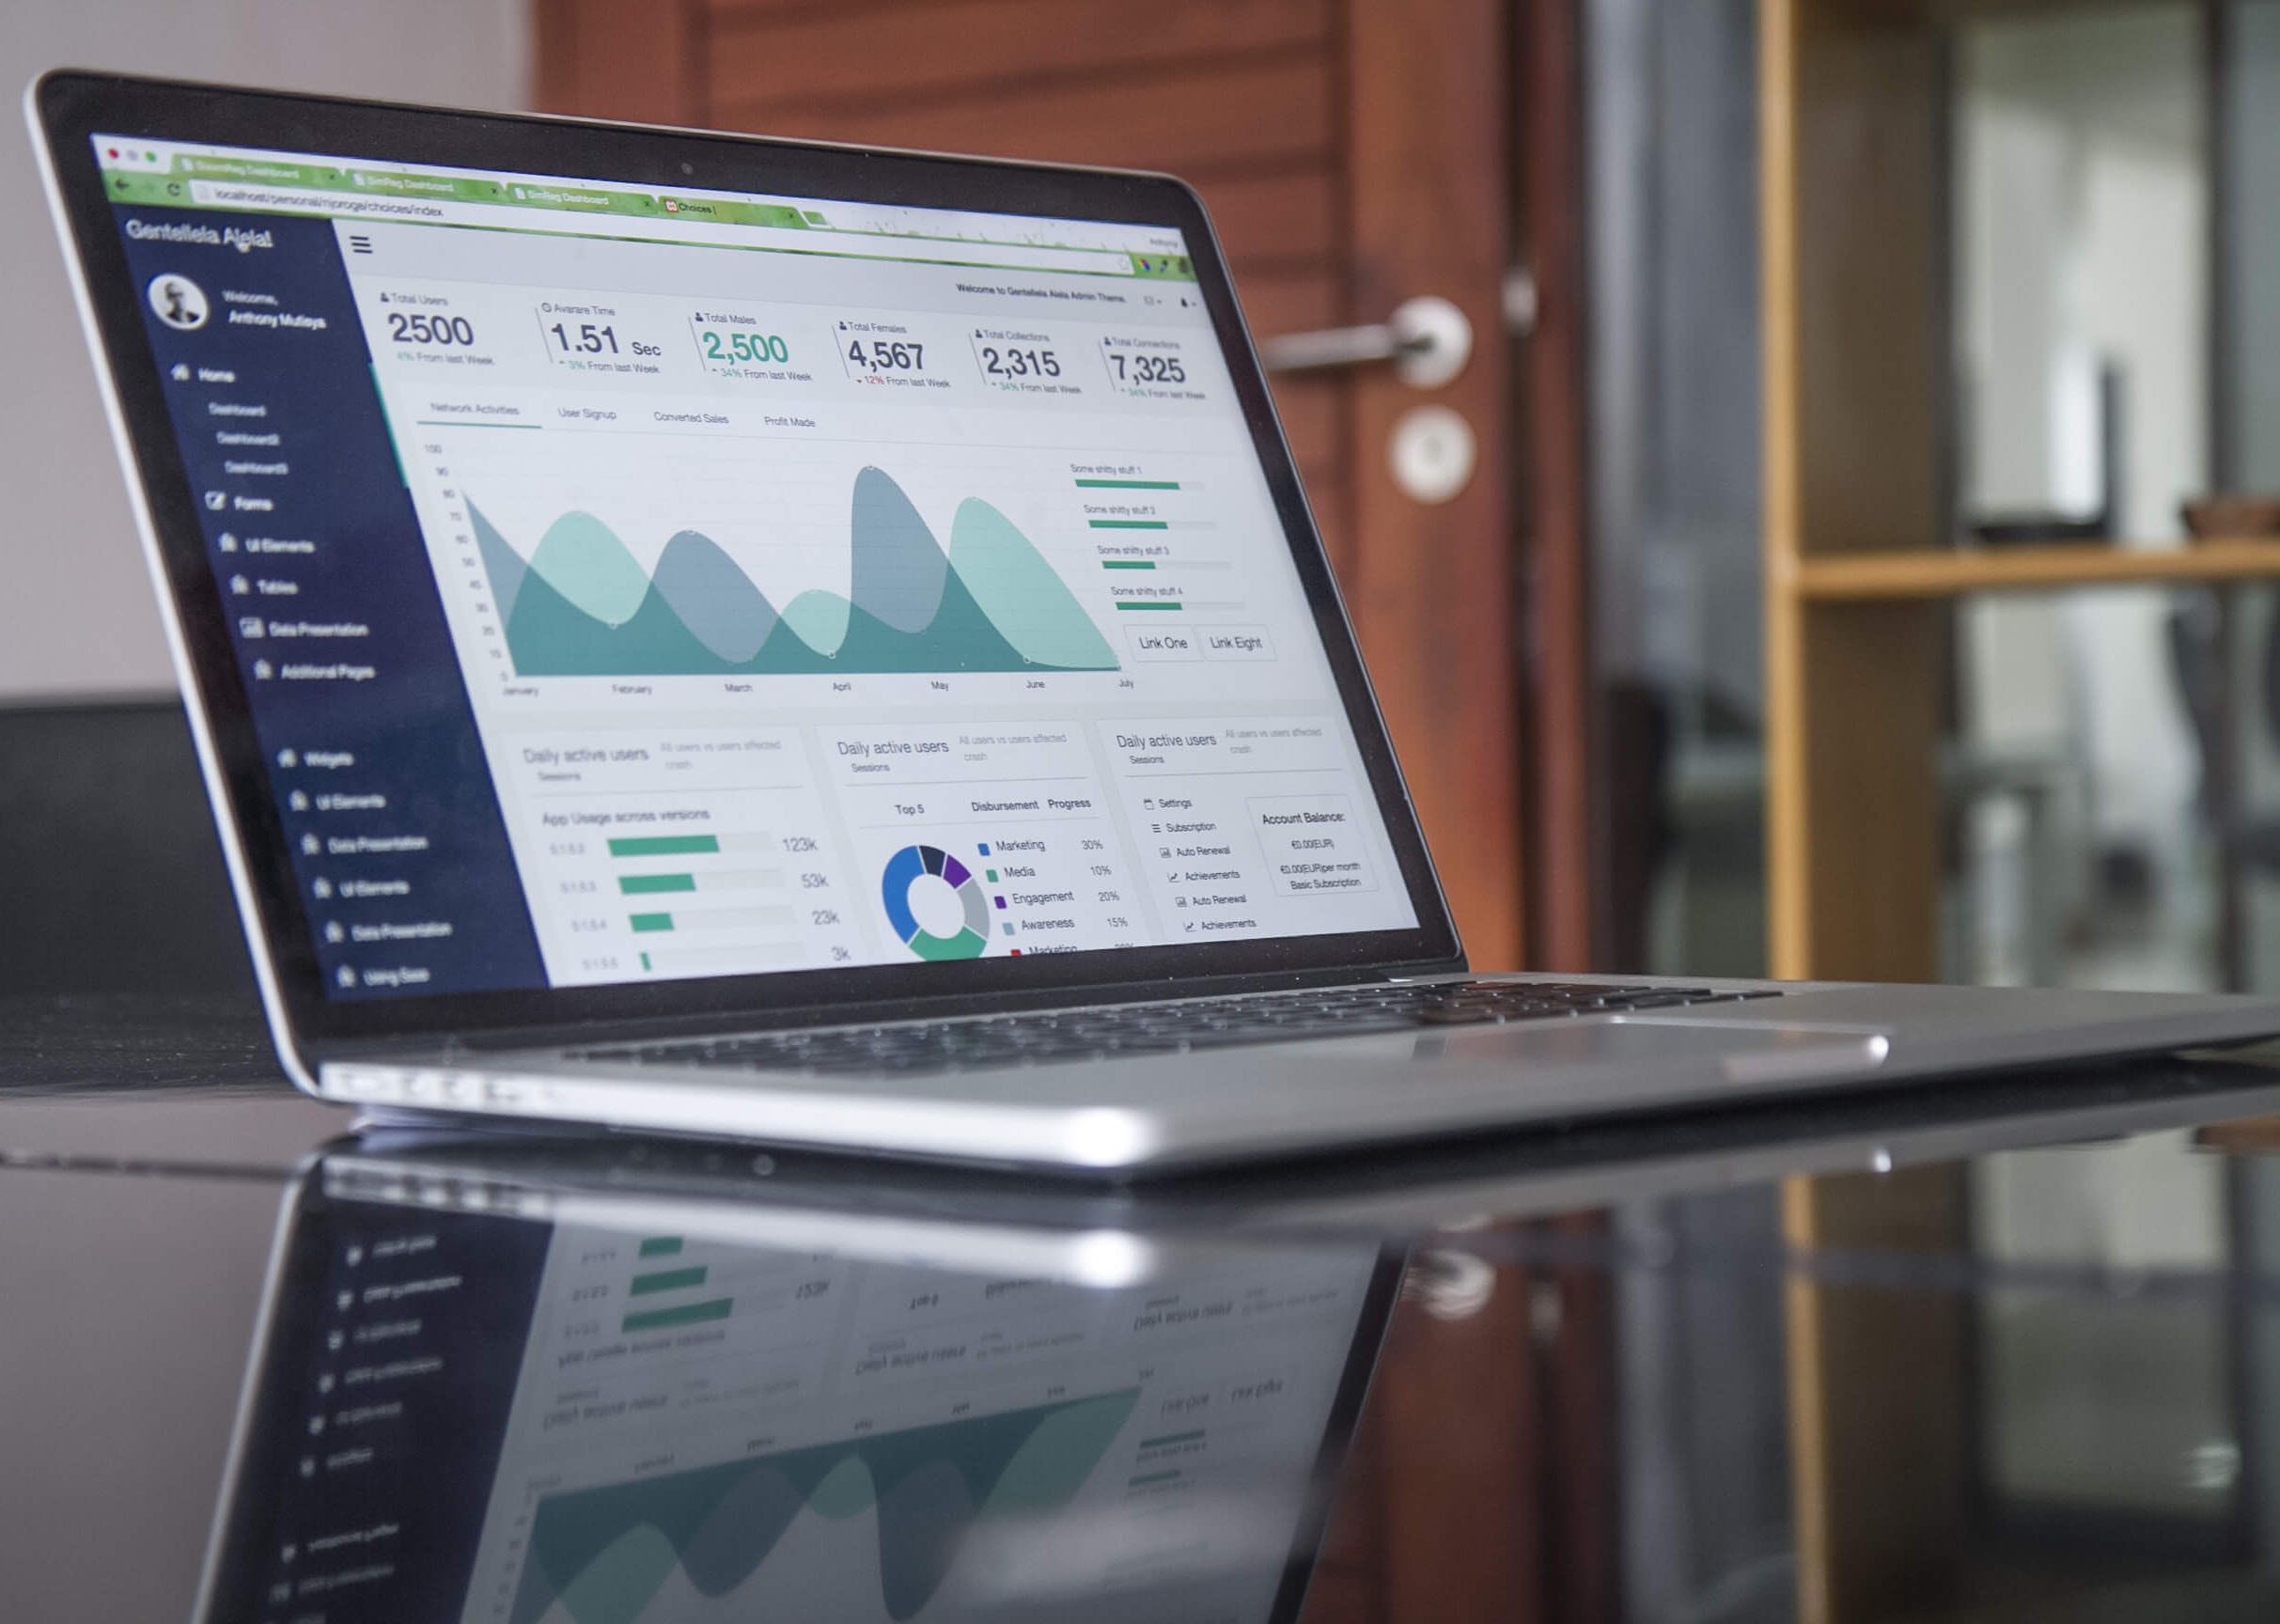
A Dashboard is a visual representation that gives executives a quick and easy way to view their company’s performance in a one-page summary of the analysis of the information. It is an overview of your system at a glance; it’s an integrated business management solution that automates financial, customer relationship and supply chain processes, a flexible ad hoc reporting and analysis based on real-time data from disparate data sources. Dashboards help you move beyond the burden of spreadsheets and reports.
Dashboards continue to get much attention in most organisations, not just because of their visual appeal, but they help organisations communicate strategy, monitor and adjust the execution of the plan, and deliver insights to all. The ideal executive dashboard automatically, securely and continuously updates your information in real-time.
How Dashboards Work
Dashboards work by connecting, via APIs or "application programming interfaces," with the business systems you currently use. These systems include, among others, your accounting software, your customer relationship management (CRM) system, your email system, your website analytics program. The Dashboard pulls all this information into one place, so you don't have to log into multiple systems. It can also manipulate this data, so the information is in a more accessible format for everyone to access to it, rather than being housed on one individual’s desktop. The ability to see your data from different perspectives is invaluable under any circumstances.
Key Benefits of Dashboards:
Choosing what metrics to track. So you can understand and improve them.
Integrate data from disparate sources.
Preserve data in a central location.
Visibility/insight to see, at a glance, an overall situation report of the desired information.
View data from select time slices in different ways to identify essential patterns that have been hidden from sight.
Customisable regarding users and expectations, allows each person to see the level of detail they need to get their job done and meet their goals.
All-in-one to see, at a glance, an overall situation report of the desired information.
Drill into detail to get as more in-depth in information as required by merely selecting the desired variable or object.
Intuitive data presentation to any user. The graphic design allows easy and smooth navigation throughout the information.
Mobile software device accessible, programmed to suit any mobile device. The idea is to reach anywhere, to everyone, promptly with the most accurate information.
Ongoing improvements to measure your performance throughout your organisation.
Precious time savings each month, as you get the latest results from each report you need.
Judge Performance Against Your Plan. You can automatically show your goals from your business plan versus your actual, real-time results.
Employee Performance Improvements: When employees know their performance is being judged in a dashboard and can see their results, they automatically improve their work.
Key challenges of executive dashboards
Start with the most critical parameter of your company or division. After determining this key metric, figure out the “underlying” metrics. That is, what factors influence Net Income, that is impacted by sales, revenues, and advertising costs. Sales might be controlled by the number of leads your firm receives, how many proposals you issue, your close proposal ratio, your average sales price.
Each of these underlying metrics should be tracked in your dashboard so you can understand and improve them.
Conclusions: Dashboards provide visually-appealing and cost-effective dashboard software for a wide variety of industries, with customisable dashboard solutions that easily integrate data sources. Clients can quickly and effectively analyse performance metrics leading to enhanced decision-making. Dashboards help you move beyond the burden of spreadsheets and reports and allows you to manage your business better and thus improve sales and profits.
Dave Food